Writing / Math
Markov Chains explained visually
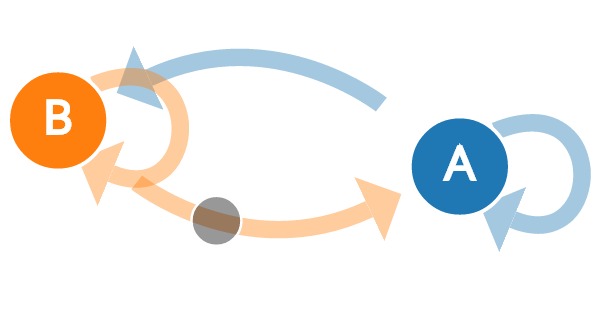
Watch states hop around and tune transition probabilities to see how Markov chains behave.
markov chainsprobability
Published 2014-11-07 · Catalog date
Math · Computer Science
Explained Visually: interactive explanations of math and statistics concepts.
setosa.io5 selected projects, with credit and a path to the original.
Watch states hop around and tune transition probabilities to see how Markov chains behave.
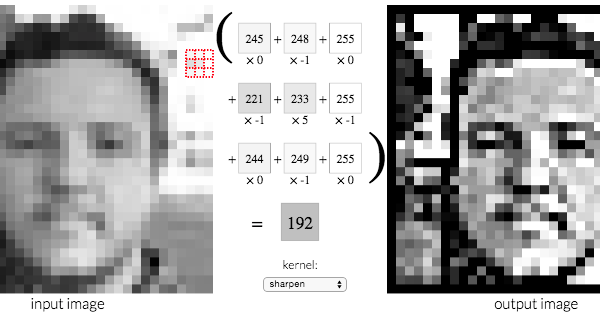
Apply kernels to an image pixel by pixel to see blur, sharpen and edge detection.
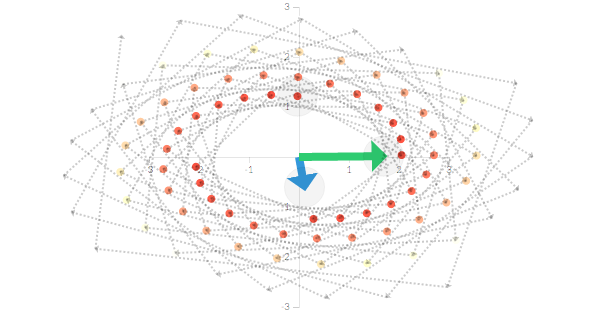
Drag vectors through a transformation to see which directions only stretch.
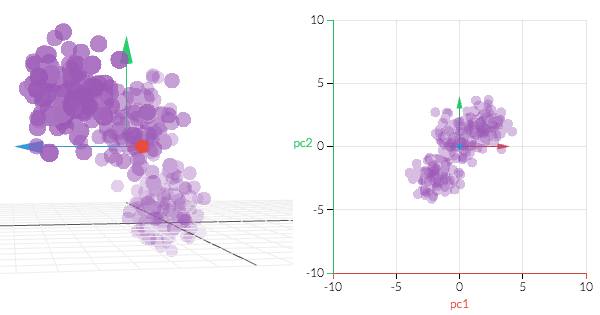
Rotate and project data to see how PCA finds the axes of greatest variance.
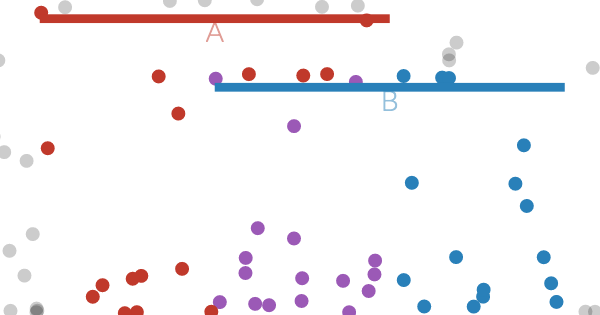
Drop balls through shelves to build intuition for conditional probability.
Original publication and update records, plus explicitly labeled repository milestones.
Principal Component Analysis explained visually — publication date recorded by Explainer Tools.
Principal Component Analysis explained visually · Source Catalog publication date; linked original sourceImage Kernels explained visually — publication date recorded by Explainer Tools.
Image Kernels explained visually · Source Catalog publication date; linked original sourceEigenvectors and Eigenvalues explained visually — publication date recorded by Explainer Tools.
Eigenvectors and Eigenvalues explained visually · Source Catalog publication date; linked original sourceMarkov Chains explained visually — publication date recorded by Explainer Tools.
Markov Chains explained visually · Source Catalog publication date; linked original sourceConditional probability explained visually — publication date recorded by Explainer Tools.
Conditional probability explained visually · Source Catalog publication date; linked original sourceExplained Visually: interactive explanations of math and statistics concepts.
This selection connects 5 projects across writing. Follow the project links for the original experience; use the build log for dated context where evidence is available.
Compiled from public catalog attributions and linked original sources. Descriptions are editorial summaries, not statements made by the creator. This profile has not been claimed or endorsed.
Catalog sources gathered October 23, 2026. Primary-source access varies, particularly on social platforms. This is a selected portfolio, not a lifetime total. Images remain credited to their original creators.
Interactive stories, playful explanations, and little tools that make big ideas feel human.
Visual essays and a growing digital garden about programming, design, and anthropology.
Interactive explanations of maps, pathfinding, and the math behind game development at Red Blob Games.