Principal Component Analysis explained visually
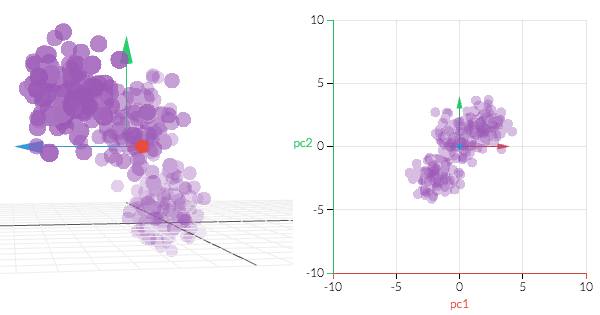
Rotate and project data to see how PCA finds the axes of greatest variance.
Catalog date: 2015-02-12
Source: Explainer Tools
Mobile compatibility has not been confirmed.
Rotate and project data to see how PCA finds the axes of greatest variance.
Catalog date: 2015-02-12
Source: Explainer Tools
Mobile compatibility has not been confirmed.